BlazorTelemetryClient.ChannelMediator
1.0.3.1
dotnet add package BlazorTelemetryClient.ChannelMediator --version 1.0.3.1
NuGet\Install-Package BlazorTelemetryClient.ChannelMediator -Version 1.0.3.1
<PackageReference Include="BlazorTelemetryClient.ChannelMediator" Version="1.0.3.1" />
<PackageVersion Include="BlazorTelemetryClient.ChannelMediator" Version="1.0.3.1" />
<PackageReference Include="BlazorTelemetryClient.ChannelMediator" />
paket add BlazorTelemetryClient.ChannelMediator --version 1.0.3.1
#r "nuget: BlazorTelemetryClient.ChannelMediator, 1.0.3.1"
#:package BlazorTelemetryClient.ChannelMediator@1.0.3.1
#addin nuget:?package=BlazorTelemetryClient.ChannelMediator&version=1.0.3.1
#tool nuget:?package=BlazorTelemetryClient.ChannelMediator&version=1.0.3.1
<div align="center">
BlazorTelemetry
Essential .NET observability in a self-hosted Blazor interface.
Collect, correlate, and explore your OpenTelemetry logs, traces, and metrics over OTLP gRPC or HTTP/protobuf without operating a full distributed observability stack.





</div>
Why BlazorTelemetry ?
BlazorTelemetry is designed for small .NET teams that need to understand their applications quickly while keeping the infrastructure simple to operate.
- One service to deploy — OTLP collector, storage, user interface, and alerting.
- Three signals in one place — structured logs, distributed traces, and metrics.
- Immediate correlation — move from a log to its trace through
TraceIdandSpanId. - Durable local storage — SQLite with configurable retention and a database size budget.
- Two operating modes — a standalone Docker application or an embedded Blazor Server dashboard.
- Built for investigation — full-text search, service filters, live refresh, shared dashboards, and persistent incidents.
BlazorTelemetry favors the simplicity of a single instance. It is not intended to replace a distributed platform such as Grafana, Prometheus, Loki, or Tempo for very high volumes or high-availability deployments.
Product tour
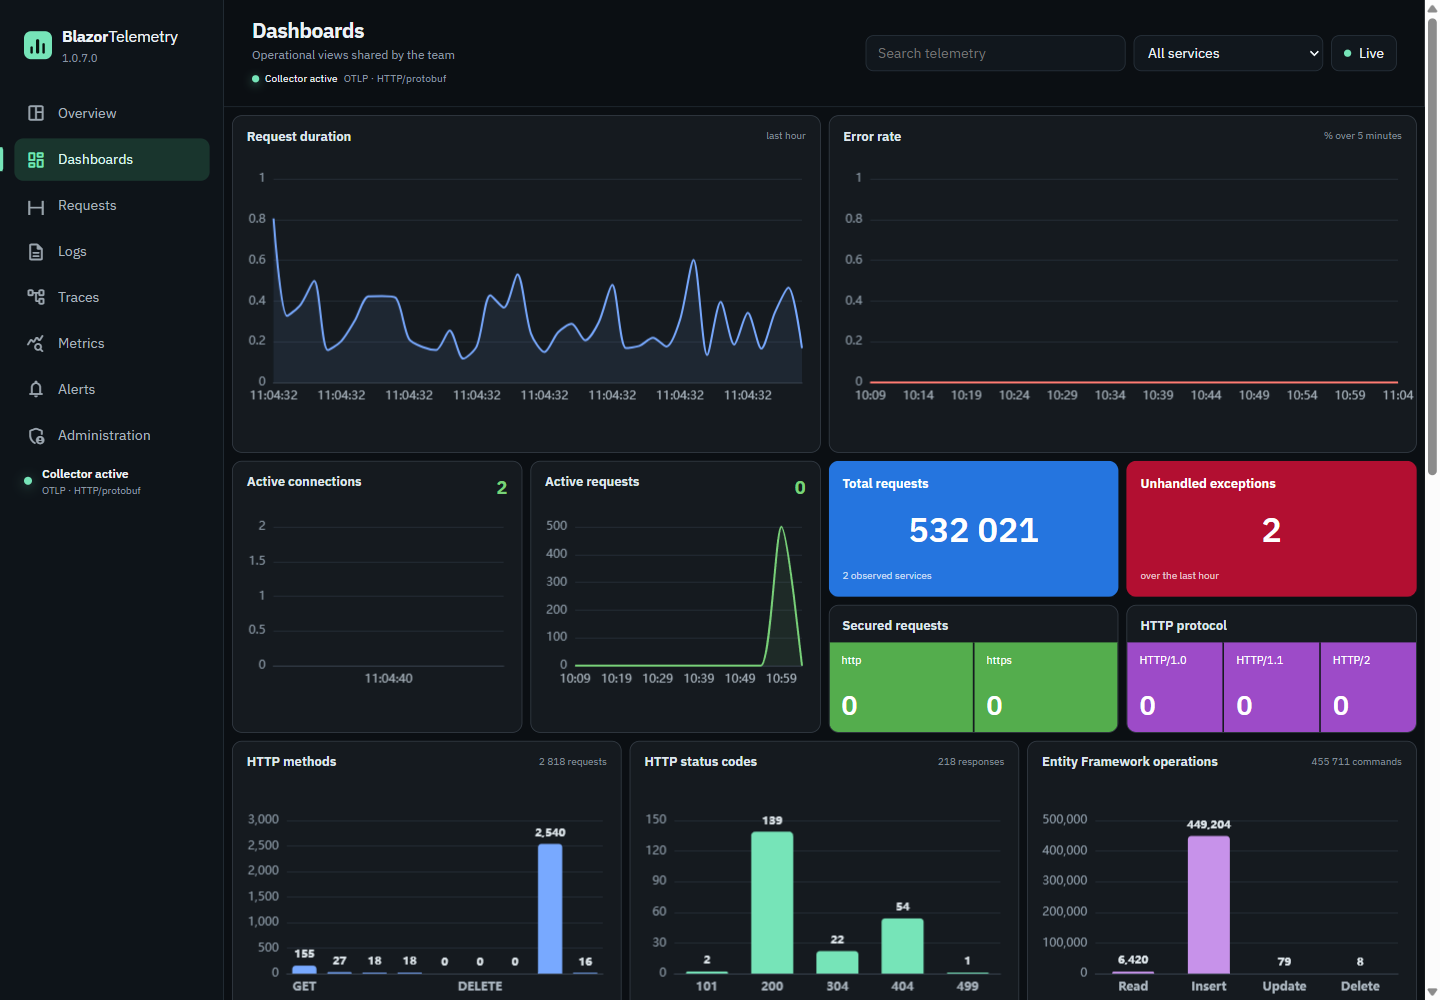
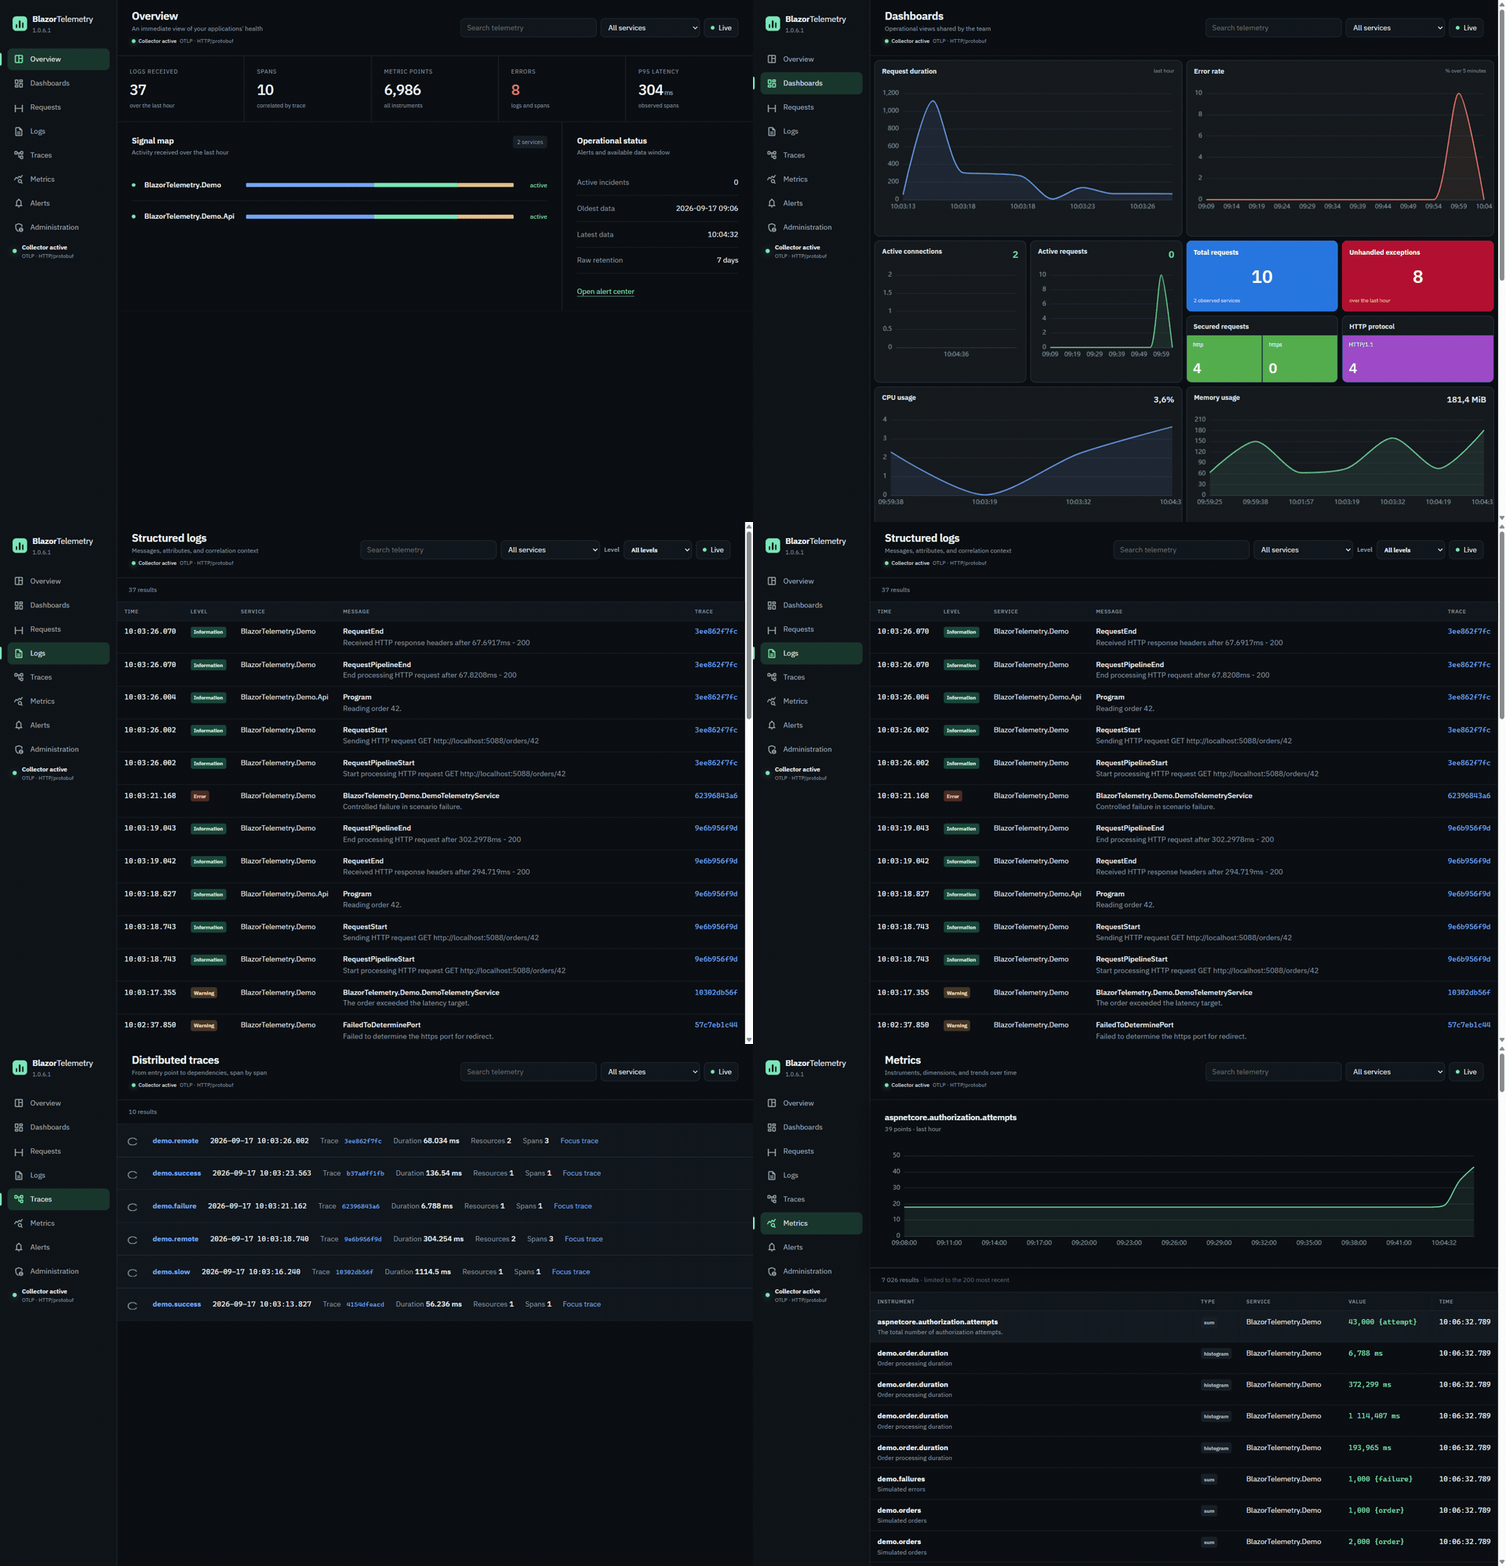
Move from the service overview to operational dashboards, structured logs, distributed traces, and metrics without leaving the application. The dashboard highlights HTTP methods, response status codes, and Entity Framework read/write operations at a glance.
Investigate without switching tools
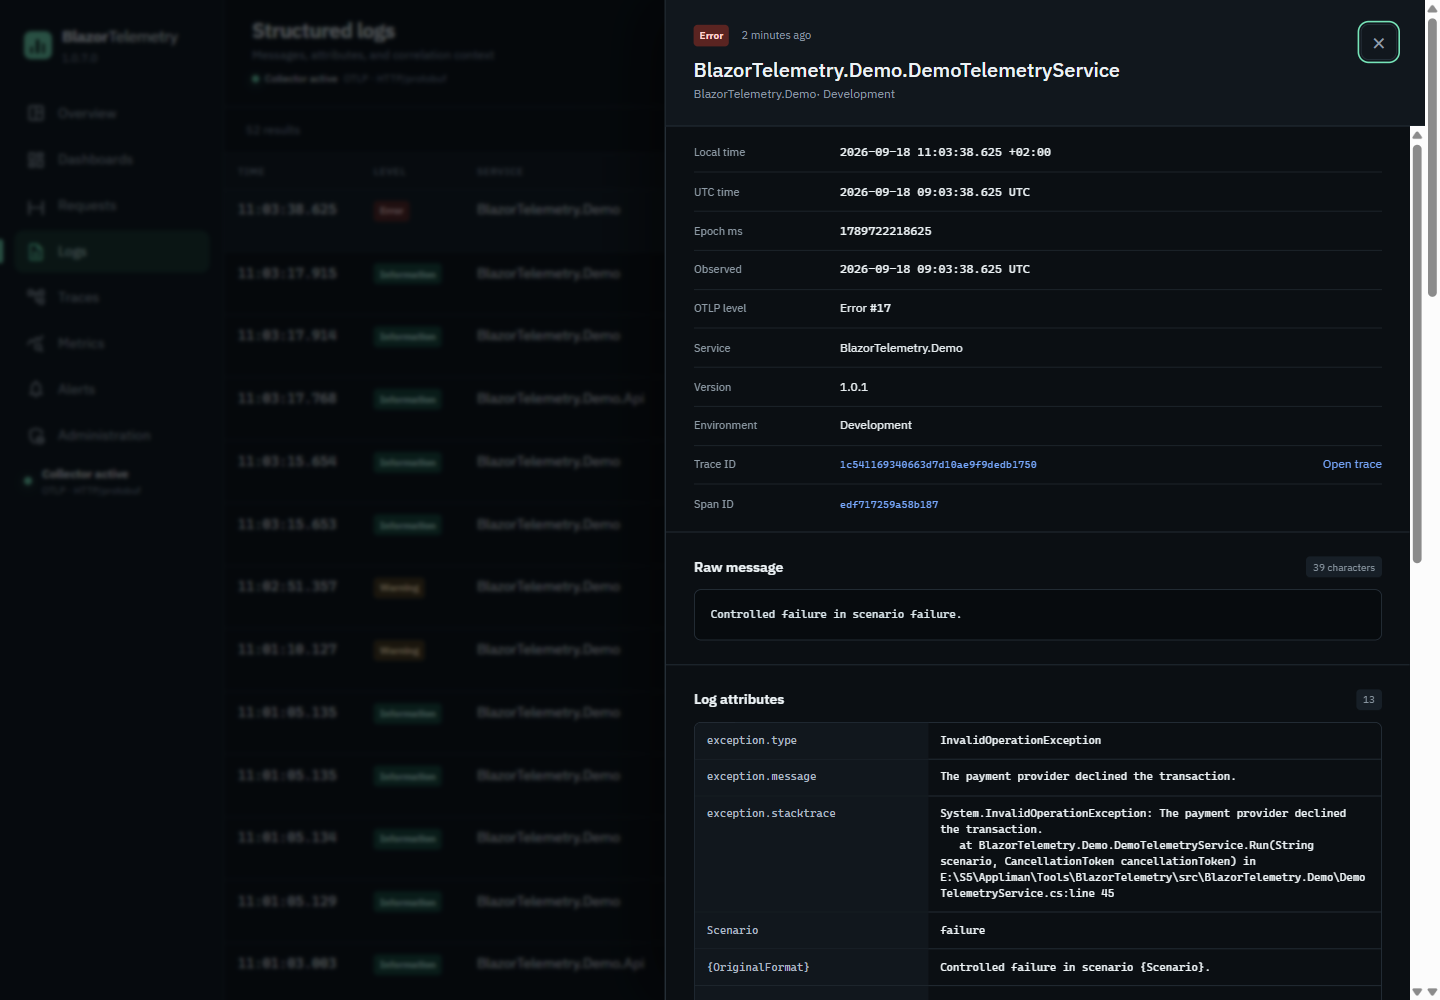
The detail drawer exposes the OTLP level, service, environment, timestamps, attributes, and correlation identifiers. Selecting the TraceId opens the related trace directly.
Responsive by design
The overview and operational dashboards remain usable on mobile, with compact navigation and filters adapted to the available width.
<table> <tr> <td width="50%" align="center"><strong>Overview</strong></td> <td width="50%" align="center"><strong>Operational dashboard</strong></td> </tr> <tr> <td align="center"><img src="https://raw.githubusercontent.com/appliman/blazortelemetry/main/docs/images/mobile-overview.png" alt="BlazorTelemetry mobile overview" width="390"></td> <td align="center"><img src="https://raw.githubusercontent.com/appliman/blazortelemetry/main/docs/images/mobile-dashboard.png" alt="BlazorTelemetry mobile dashboard" width="390"></td> </tr> </table>
Features
| Area | Capabilities |
|---|---|
| Collection | OTLP HTTP/protobuf on /v1/logs, /v1/traces, and /v1/metrics |
| Exploration | Global search, service filters, time windows, and live refresh |
| Correlation | Navigation across logs, traces, and spans using TraceId and SpanId |
| Dashboards | Request duration, error rate, HTTP method and status-code distributions, Entity Framework operations, activity, protocols, and endpoint insights |
| Alerts | Alert rules, persistent incidents, and state tracking |
| Notifications | Webhook, SMTP, and ntfy |
| Security | Optional ingestion keys and passwordless TOTP authentication |
| Storage | SQLite, automatic cleanup, separate retention policies, and a size budget |
| Deployment | Local Docker, staging, and production behind Traefik |
Architecture
flowchart LR
    A[.NET applications] -->|OTLP HTTP/protobuf| B[OTLP endpoints]
    B --> C[Bounded ingestion queue]
    C --> D[Asynchronous writer]
    D --> E[(SQLite)]
    E --> F[Blazor dashboard]
    E --> G[Alert engine]
    G --> H[Webhook / SMTP / ntfy]
OTLP reception is decoupled from database writes through a bounded queue. Background services then manage persistence, retention, alert evaluation, and notification delivery.
Quick start with Docker
Prerequisites
- Docker Desktop or Docker Engine with Docker Compose.
- Two private values: the administrator email and a shared TOTP secret.
From the src directory, create a local .env file. It is ignored by Git:
BLAZOR_TELEMETRY_ADMIN_EMAIL=admin@example.com
BLAZOR2FA_SECRET_KEY=replace-with-a-long-random-secret
Start the container:
cd src
docker compose up --build -d
Open http://localhost:8080/login/qr-code, enter the configured BLAZOR2FA_SECRET_KEY, and scan the generated QR code with your authenticator app. You can then sign in at http://localhost:8080/login with the administrator email and the current six-digit code.
The telemetry database and ASP.NET Core Data Protection keys are persisted in the blazor-telemetry-dev-data Docker volume. No password or local user database is used.
Instrument a Blazor or ASP.NET Core application
Install the preconfigured client from NuGet.org:
dotnet add package BlazorTelemetryClient
Configure the service name and the BlazorTelemetry OTLP endpoint. gRPC is used by default on port 4317:
OTEL_SERVICE_NAME=my-service
OTEL_EXPORTER_OTLP_ENDPOINT=http://localhost:4317
OTEL_EXPORTER_OTLP_PROTOCOL=grpc
Register the client once in Program.cs:
using BlazorTelemetry.Client;

var builder = WebApplication.CreateBuilder(args);

builder.Services.AddBlazorTelemetry();
This single registration enables structured logs, ASP.NET Core request traces and metrics, HttpClient telemetry, runtime metrics, client and network address enrichment, HTTP headers and body sizes, and Entity Framework traces and operation metrics. Database statements remain disabled by default to avoid exporting sensitive query values.
All standard OTEL_* environment variables remain supported. Options can also be overridden or extended in code:
using BlazorTelemetry.Client;
using OpenTelemetry.Exporter;

builder.Services.AddBlazorTelemetry(options =>
{
    options.ServiceName = "my-service";
    options.ServiceVersion = "1.0.0";
    options.DeploymentEnvironment = builder.Environment.EnvironmentName;
    options.Endpoint = new Uri("https://telemetry.example.com");
    options.Protocol = OtlpExportProtocol.HttpProtobuf;

    options.AddSource("MyCompany.MyApplication");
    options.AddMeter("MyCompany.MyApplication");
    options.AddResourceAttribute("service.namespace", "commerce");
});
The Entity Framework metrics classify completed commands as read, insert, update, delete, or other, with command counts, failures, active commands, and execution duration.
ChannelMediator instrumentation
Install the optional ChannelMediator integration:
dotnet add package BlazorTelemetryClient.ChannelMediator
Use its combined registration instead of AddBlazorTelemetry():
using BlazorTelemetry.Client.ChannelMediator;

builder.Services.AddBlazorTelemetryChannelMediator(options =>
{
    options.ServiceName = "my-service";
});
The integration registers a ChannelMediator pipeline behavior and automatically configures the required OpenTelemetry source and meter. Each handler produces a correlated internal span together with request, failure, active-request, and duration metrics. Request and response type names are attached to the telemetry for filtering.
OTLP HTTP/protobuf remains available on the web endpoint through /v1/logs, /v1/traces, and /v1/metrics.
Ingestion key validation is disabled by default, so no authentication header is required. In this mode, restrict access to the OTLP endpoints at the network or reverse-proxy layer, for example with an IP allowlist.
To require a key, set BlazorTelemetry__RequireIngestionKey=true (BLAZOR_TELEMETRY_REQUIRE_INGESTION_KEY=true with the provided Docker Compose files), create a key from the administration interface, and send it through OTEL_EXPORTER_OTLP_HEADERS=X-BlazorTelemetry-Key=replace-with-the-generated-key. Configured keys are compared in constant time. Keys created from the administration interface are stored as SHA-256 hashes and are displayed only once.
Embed the dashboard in a Blazor application
BlazorTelemetry can also be integrated directly into a Blazor Server or interactive SSR application:
using BlazorTelemetry.AspNetCore;

builder.Services
    .AddRazorComponents()
    .AddInteractiveServerComponents();

builder.Services.AddBlazorTelemetry(builder.Configuration);

// ...

app.UseBlazorTelemetry();
app.MapBlazorTelemetry();
app.MapRazorComponents<App>()
    .AddInteractiveServerRenderMode()
    .AddAdditionalAssemblies(typeof(BlazorTelemetry.TelemetryDashboard).Assembly);
Then render the dashboard from a Razor page:
@page "/telemetry"
@rendermode InteractiveServer

<TelemetryDashboard />
The host application must provide the BlazorTelemetryReader and BlazorTelemetryAdministrator authorization policies.
Configuration reference
The BlazorTelemetry section can be configured in appsettings.json or through environment variables using __ as the section separator.
| Key | Default | Description |
|---|---|---|
ConnectionString |
Data Source=Data/telemetry.db |
Telemetry SQLite database |
RawRetentionDays |
7 |
Retention for raw logs and traces |
MetricRetentionDays |
30 |
Retention for metric points |
MaximumDatabaseBytes |
10737418240 |
Maximum database budget: 10 GiB |
MaximumRequestBytes |
8388608 |
Maximum OTLP request size: 8 MiB |
RequireIngestionKey |
false |
Reject ingestion requests without a valid key when enabled |
IngestionKeys |
{} |
application → key dictionary |
Environment variable example:
BlazorTelemetry__RawRetentionDays=14
Deploy behind Traefik
Two Compose files are provided for a VPS running Traefik:
src/docker-compose.staging.ymldefaults toghcr.io/appliman/blazor-telemetry:staging.src/docker-compose.prod.ymldefaults toghcr.io/appliman/blazor-telemetry:latest.
The external Docker network traefik-public must already exist. Supply the domain without a protocol or path:
cd src
DOMAIN=telemetry.example.com \
BLAZOR_TELEMETRY_ADMIN_EMAIL=admin@example.com \
BLAZOR2FA_SECRET_KEY='replace-with-a-long-random-secret' \
docker compose -f docker-compose.prod.yml up -d
Traefik handles HTTP-to-HTTPS redirection, TLS certificates, and routing to the internal port 8080. The /health/live endpoint is used for health checks.
Development
dotnet restore BlazorTelemetry.slnx
dotnet test BlazorTelemetry.slnx --configuration Release
dotnet run --project src/BlazorTelemetry.Host/BlazorTelemetry.Host.csproj
The solution is split into focused projects:
| Project | Responsibility |
|---|---|
BlazorTelemetry.Core |
Domain model, options, and storage contracts |
BlazorTelemetry.Sqlite |
EF Core context, migrations, and SQLite repository |
BlazorTelemetry.AspNetCore |
OTLP endpoints and background services |
BlazorTelemetry |
Razor components and dashboard interface |
BlazorTelemetry.Host |
Standalone application secured by passwordless TOTP authentication |
BlazorTelemetry.Demo |
Embedded dashboard demonstration |
BlazorTelemetry.Demo.Api |
Instrumented API producing logs, traces, and metrics |
BlazorTelemetry.Tests |
OTLP parser and persistence tests |
Current scope
BlazorTelemetry targets a single instance serving approximately 1 to 10 applications and an initial target flow of about 100 telemetry items per second. These values describe the initial product scope; they are not a contractual benchmark.
For high availability, distributed storage, PromQL/LogQL querying, or very high throughput, use a dedicated distributed observability platform.
| Product | Versions Compatible and additional computed target framework versions. |
|---|---|
| .NET | net10.0 is compatible. net10.0-android was computed. net10.0-browser was computed. net10.0-ios was computed. net10.0-maccatalyst was computed. net10.0-macos was computed. net10.0-tvos was computed. net10.0-windows was computed. |
-
net10.0
- BlazorTelemetryClient (>= 1.0.12.1)
- ChannelMediator (>= 1.1.20)
NuGet packages
This package is not used by any NuGet packages.
GitHub repositories
This package is not used by any popular GitHub repositories.