MetricsReporter 0.4.7
dotnet add package MetricsReporter --version 0.4.7
NuGet\Install-Package MetricsReporter -Version 0.4.7
<PackageReference Include="MetricsReporter" Version="0.4.7" />
<PackageVersion Include="MetricsReporter" Version="0.4.7" />
<PackageReference Include="MetricsReporter" />
paket add MetricsReporter --version 0.4.7
#r "nuget: MetricsReporter, 0.4.7"
#:package MetricsReporter@0.4.7
#addin nuget:?package=MetricsReporter&version=0.4.7
#tool nuget:?package=MetricsReporter&version=0.4.7
MetricsReporter
Turn your C# chaos into Coupling < 5 and Complexity < 15. In one prompt. Measurably.
![]()

![]()
![]()


MetricsReporter is a .NET 8 CLI tool that aggregates code coverage, complexity, coupling, and analyzer violations from three independent sources into one interactive dashboard — then lets you (or your AI agent) fix everything via a structured refactoring loop.
  coverage.xml  +  metrics.xml  +  violations.sarif   →   one interactive HTML
  (OpenCover)      (Roslyn)        (Analyzers)              + unified JSON
Production-Ready Example
MetricsReporter is also demonstrated on the production-ready baidakovil/eShop repository, a fork of Microsoft's dotnet/eShop, which shows a full end-to-end setup on a non-trivial solution: Roslyn metrics, SARIF diagnostics, OpenCover coverage, ReportGenerator output, AI-assisted refactoring, and a published HTML dashboard.
▶ Open Production-Ready eShop Demo
The Problem
Your C# project has growing tech debt, but:
- Coverage, metrics, and violations live in three separate files — OpenCover XML, Roslyn XML, and SARIF JSON
- No single view shows coupling, complexity, coverage, and analyzer violations together
- You can't measure whether a refactoring actually helped
- AI agents don't know which method to fix first or whether the fix worked
Quick Start
# Install
dotnet tool install --global MetricsReporter.Tool

# Generate dashboard from your three data sources
metricsreporter generate --opencover coverage.xml --roslyn metrics.xml --sarif analyzers.sarif --output-html report.html

# Query violations from CLI — returns JSON
metricsreporter read --namespace MyApp.Services --metric Coupling
# → [{"kind":"Type","fullyQualifiedName":"MyApp.Services.OrderService","metrics":{"RoslynClassCoupling":{"value":14,"status":"Warning"}}}]

# Verify a fix passes thresholds
metricsreporter test --symbol MyApp.Services.OrderService.Process --metric Complexity
# → {"isOk":true}
Open report.html — you'll see the dashboard from the screenshot above.
Next step → Full tutorial: produce your first dashboard · CLI reference · Configuration reference
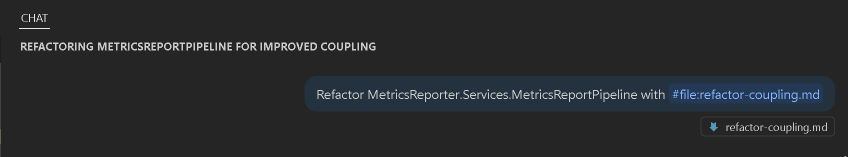
AI-Driven Refactoring
Hand your AI agent a namespace and a metric. It reads the violation, studies the code, refactors, rebuilds, verifies — all through the CLI.
# AI agent asks: "what's broken?"
metricsreporter read --namespace MyApp.Services --metric Coupling

# AI agent fixes the code, rebuilds, then verifies:
metricsreporter test --symbol MyApp.Services.OrderProcessor --metric Coupling
# → { "isOk": true }
Built-in refactoring prompts for complexity, coupling, and coverage — ready for Copilot, Cursor, or any AI agent
Cover 1,000 lines of code with tests. Automatically. The coverage workflow reads violations, writes NUnit tests with mocks, runs them, collects coverage, and verifies — until every branch is green.
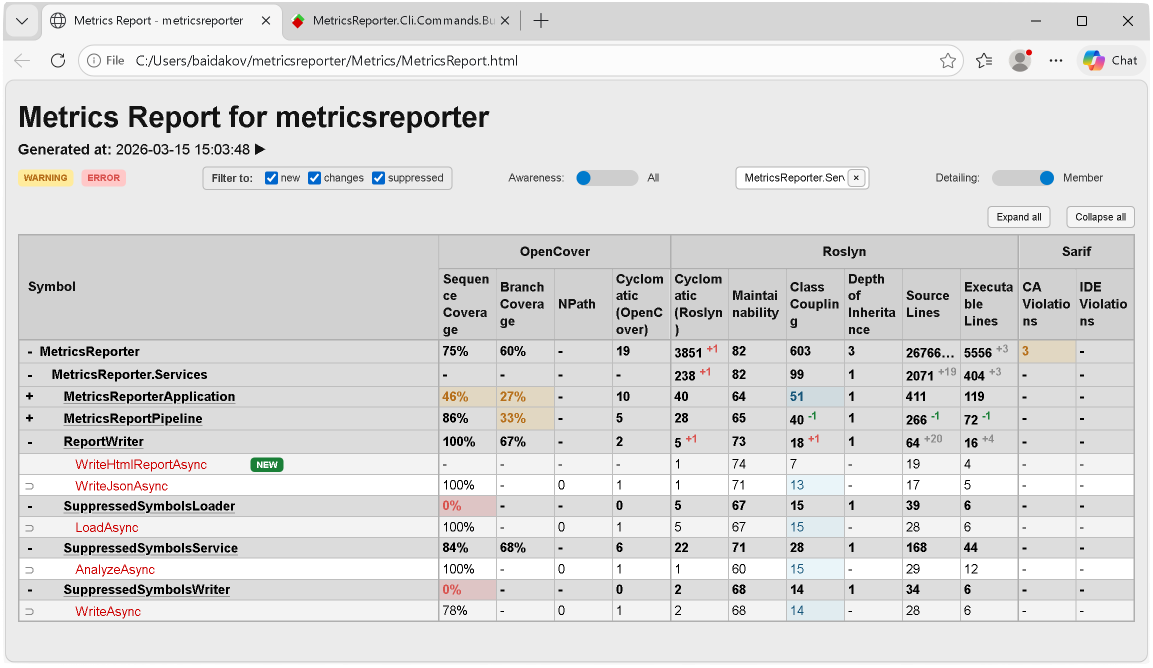
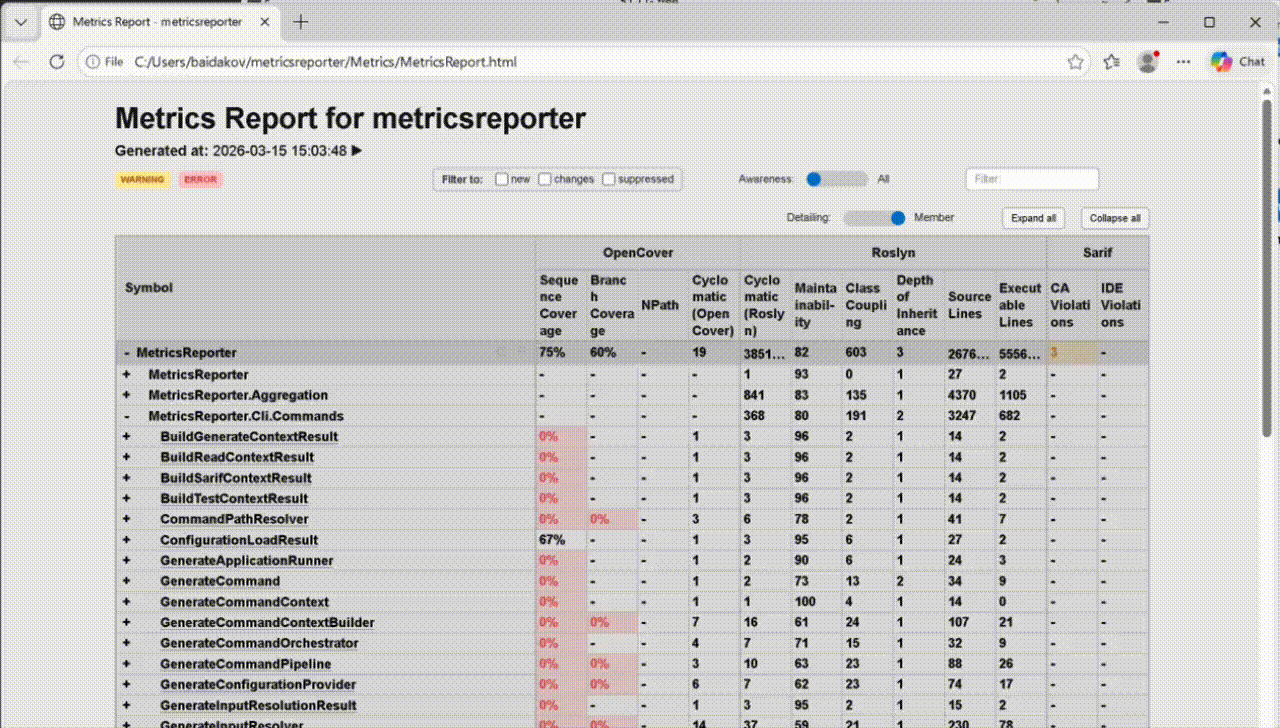
Interactive HTML Dashboard
Drill down from Solution → Assembly → Namespace → Type → Method. Filter instantly, toggle warning/error awareness, hover for metric details. No frameworks — pure JS, handles 50,000+ symbols without lag.
Aggregate statistics at a glance — coverage %, complexity distribution, violation counts
SARIF Violations with Breakdown
See exactly which CA/IDE rules fire at each level. Hover for rule descriptions, file paths, and line numbers.
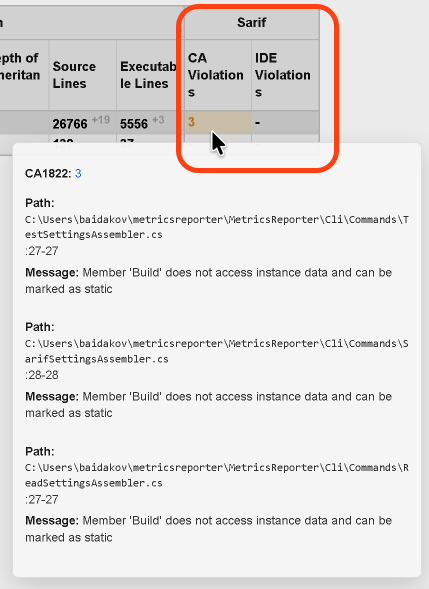
Hover any SARIF metric to see rule-by-rule breakdown with source locations
ReportGenerator Integration
Seamless integration with ReportGenerator for interactive, line-by-line coverage visualization alongside your metrics dashboard.
Line-by-line coverage maps powered by ReportGenerator
Suppression System
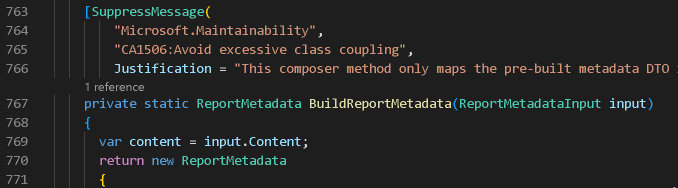
Not every violation should be fixed. Mark intentional exceptions with [SuppressMessage] — they show up in the dashboard with justifications, not as false alarms.
Suppression attribute in code
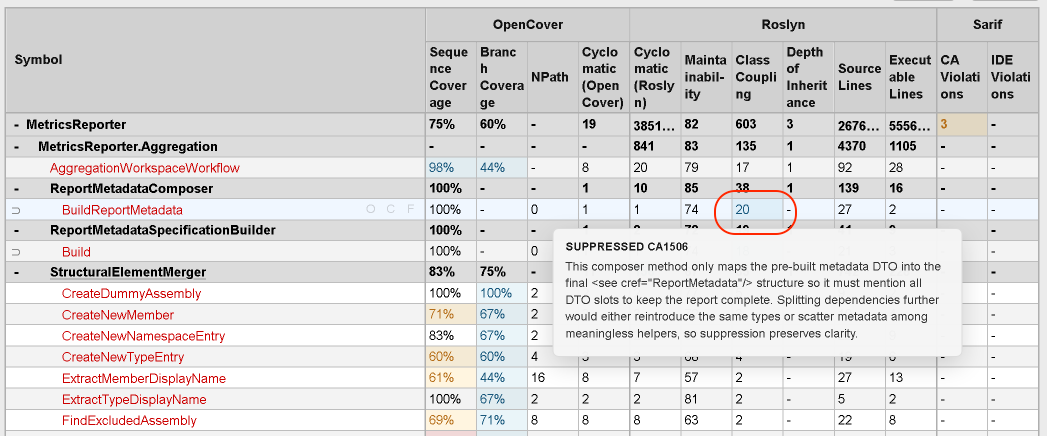
Suppression reflected in dashboard with justification tooltip
More Features
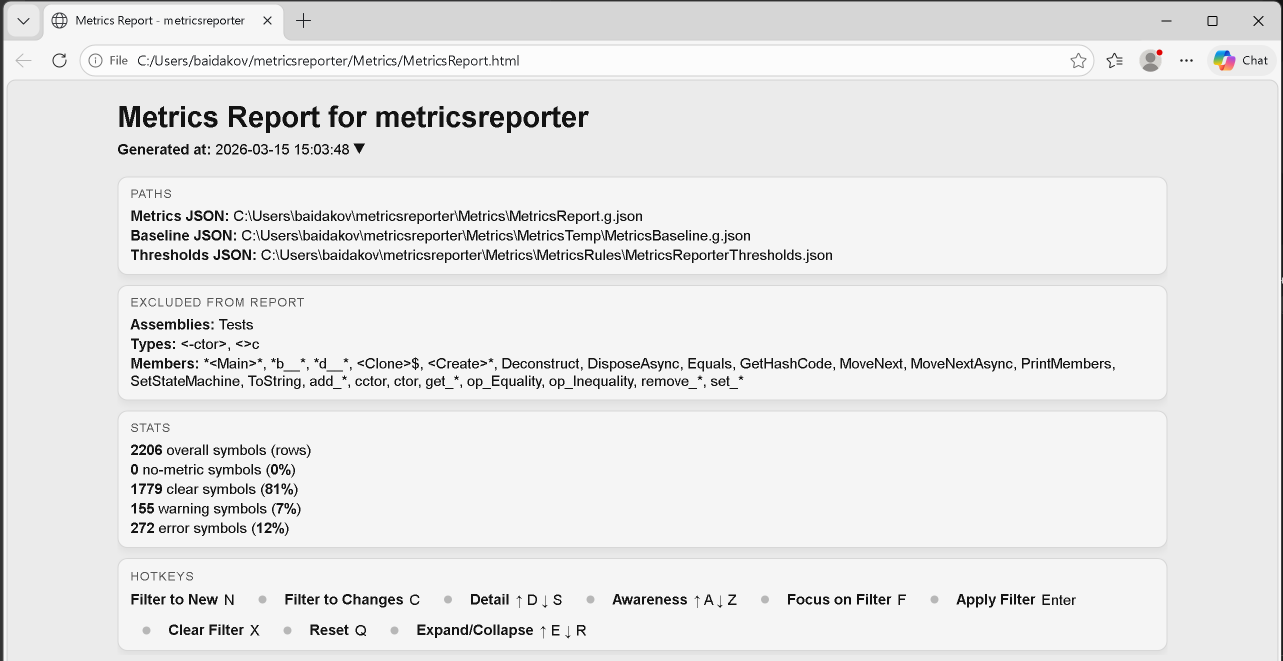
Baseline & Delta Tracking — Every run saves a baseline. Next run computes deltas automatically. See whether complexity went up or down, whether coverage improved, whether new violations appeared — per method.
Threshold Gates for CI — Define warning/error thresholds per metric per level. CLI exits with code 0 (pass) or non-zero (fail) — plug it straight into your pipeline.
{
  "RoslynClassCoupling": {
    "Type":   { "warning": 20, "error": 40 },
    "Member": { "warning": 5,  "error": 11 }
  },
  "RoslynCyclomaticComplexity": {
    "Type":   { "warning": 15, "error": 100 },
    "Member": { "warning": 15, "error": 100 }
  }
}
Smart Reconciliation — OpenCover assigns coverage to compiler-generated state machines. Roslyn lacks namespace data. MetricsReporter handles all of it — iterator coverage transferred to real methods, namespaces inferred, duplicates detected.
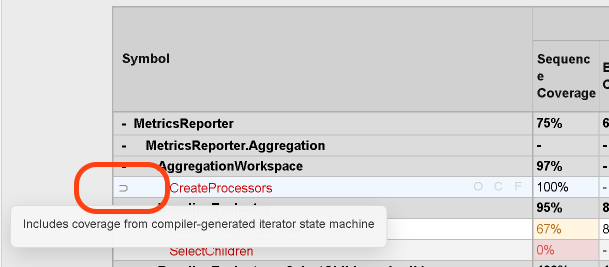
Iterator state machine coverage automatically attributed to the real method
AI Agent Workflow
MetricsReporter ships with ready-to-use prompt files for AI agents:
| Prompt file | What the agent does |
|---|---|
refactor-complexity.md |
Reduce cyclomatic complexity below thresholds |
refactor-coupling.md |
Reduce class coupling with DI, interfaces, DTOs |
refactor-coverage.md |
Write tests until branch coverage passes |
refactor-sarif.md |
Fix CA/IDE analyzer violations |
The loop:
1. metricsreporter read  → find violation
2. Study code            → plan refactoring
3. Refactor + build      → apply changes
4. metricsreporter test  → verify fix
5. Repeat until clean
Metrics Sources
| Source | Metrics |
|---|---|
| OpenCover | Sequence Coverage, Branch Coverage, Cyclomatic Complexity, NPath Complexity |
| Roslyn | Maintainability Index, Cyclomatic Complexity, Class Coupling, Depth of Inheritance, Lines of Code |
| SARIF | CA-prefix (FxCop), IDE-prefix analyzer violations with rule-level breakdown |
Links
- GitHub: github.com/baidakovil/metricsreporter
- Documentation: Full Diataxis docs
- Tutorial: Produce your first dashboard
- CLI Reference: metricsreporter-cli.md
- Configuration Reference: configuration-options.md
- Changelog: CHANGELOG.md
- License: MIT
| Product | Versions Compatible and additional computed target framework versions. |
|---|---|
| .NET | net8.0 is compatible. net8.0-android was computed. net8.0-browser was computed. net8.0-ios was computed. net8.0-maccatalyst was computed. net8.0-macos was computed. net8.0-tvos was computed. net8.0-windows was computed. net9.0 was computed. net9.0-android was computed. net9.0-browser was computed. net9.0-ios was computed. net9.0-maccatalyst was computed. net9.0-macos was computed. net9.0-tvos was computed. net9.0-windows was computed. net10.0 was computed. net10.0-android was computed. net10.0-browser was computed. net10.0-ios was computed. net10.0-maccatalyst was computed. net10.0-macos was computed. net10.0-tvos was computed. net10.0-windows was computed. |
-
net8.0
- Microsoft.CodeAnalysis.CSharp (>= 4.10.0)
- Microsoft.Extensions.Logging (>= 8.0.0)
- Microsoft.Extensions.Logging.Abstractions (>= 8.0.0)
- Microsoft.Extensions.Logging.Console (>= 8.0.0)
- Spectre.Console.Cli (>= 0.49.0)
NuGet packages
This package is not used by any NuGet packages.
GitHub repositories
This package is not used by any popular GitHub repositories.