Syncfusion.AspNetMvc.Charts
34.1.29
Prefix Reserved
dotnet add package Syncfusion.AspNetMvc.Charts --version 34.1.29
NuGet\Install-Package Syncfusion.AspNetMvc.Charts -Version 34.1.29
<PackageReference Include="Syncfusion.AspNetMvc.Charts" Version="34.1.29" />
<PackageVersion Include="Syncfusion.AspNetMvc.Charts" Version="34.1.29" />
<PackageReference Include="Syncfusion.AspNetMvc.Charts" />
paket add Syncfusion.AspNetMvc.Charts --version 34.1.29
#r "nuget: Syncfusion.AspNetMvc.Charts, 34.1.29"
#:package Syncfusion.AspNetMvc.Charts@34.1.29
#addin nuget:?package=Syncfusion.AspNetMvc.Charts&version=34.1.29
#tool nuget:?package=Syncfusion.AspNetMvc.Charts&version=34.1.29
Syncfusion® ASP.NET MVC UI Controls
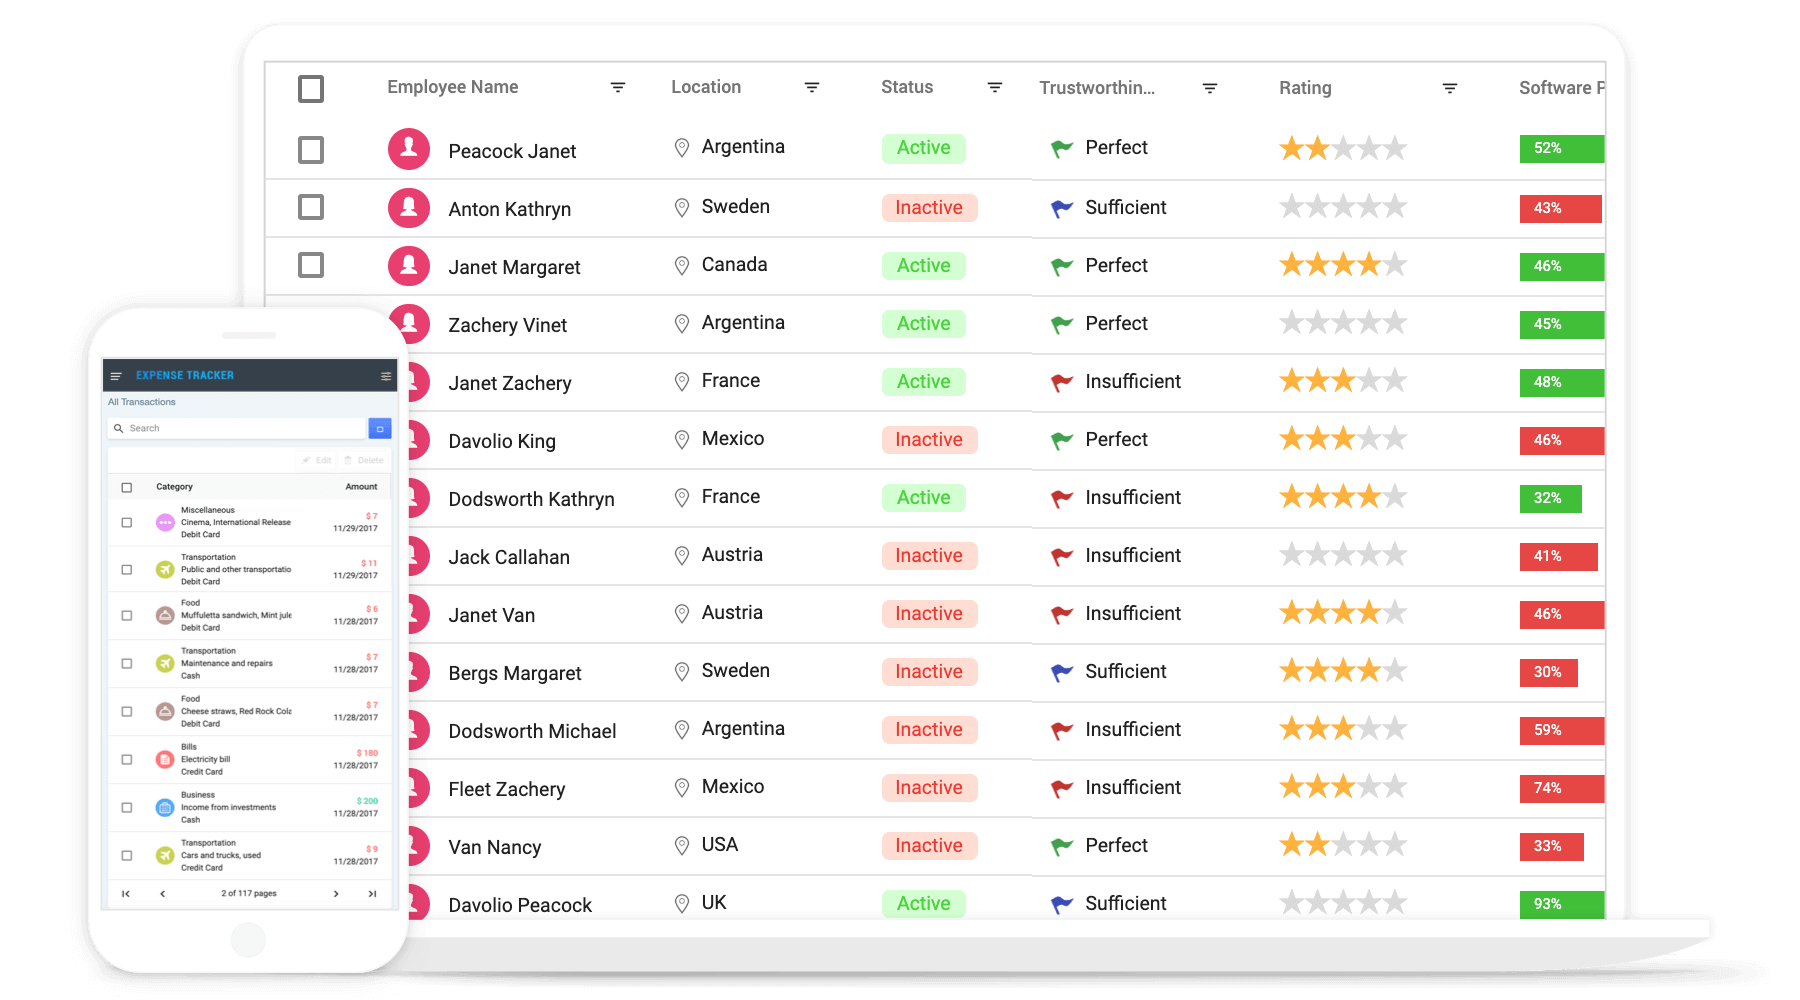
Syncfusion® ASP.NET MVC UI controls are built from the ground up to be lightweight, responsive, and touch- friendly. It includes over 90+ controls, including grid, charts, scheduler, spreadsheet, gantt chart, listbox, file manager, rich text editor and much more.
System Requirements
Getting Started
- Getting Started with ASP.NET MVC controls
- Getting Started with ASP.NET MVC controls using project templates
Help Resources
- ASP.NET MVC UI Controls Features Overview
- ASP.NET MVC UI Controls Documentation
- ASP.NET MVC UI Controls Demos
Support and feedbacks
- For queries, reach our Syncfusion® support team or post the queries through the community forums.
- Request new feature through Syncfusion® feedback portal.
License
This is a commercial product and requires a paid license for possession or use. Syncfusion® licensed software, including this component, is subject to the terms and conditions of Syncfusion® EULA. You can purchase a license here or start a free 30-day trial here.
About Syncfusion®
Founded in 2001 and headquartered in Research Triangle Park, N.C., Syncfusion® has more than 29,000 customers and more than 1 million users, including large financial institutions, Fortune 500 companies, and global IT consultancies.
Today, we provide 1800+ components and frameworks for web ASP.NET MVC, ASP.NET Core, (Blazor, ASP.NET WebForms, JavaScript, Angular, React, Vue, and Flutter), mobile (Xamarin, Flutter, UWP, and JavaScript), and desktop development (WinForms, WPF, WinUI, Flutter and UWP). We provide ready-to-deploy enterprise software for dashboards, reports, data integration, and big data processing. Many customers have saved millions in licensing fees by deploying our software.
sales@syncfusion.com | www.syncfusion.com | Toll Free: 1-888-9 DOTNET
| Product | Versions Compatible and additional computed target framework versions. |
|---|---|
| .NET Framework | net462 is compatible. net463 was computed. net47 was computed. net471 was computed. net472 was computed. net48 was computed. net481 was computed. |
-
- Newtonsoft.Json (>= 13.0.3)
- Syncfusion.AspNetMvc.Base (>= 34.1.29)
- Syncfusion.EJ2.JavaScript (>= 34.1.29)
- Syncfusion.Licensing (>= 34.1.29)
NuGet packages (8)
Showing the top 5 NuGet packages that depend on Syncfusion.AspNetMvc.Charts:
| Package | Downloads |
|---|---|
|
Syncfusion.AspNetMvc.Sankey
Syncfusion® ASP.NET MVC Sankey Chart control visualizes flow and the proportional relationships between entities using directed paths with varying widths. It is ideal for representing energy flow, resource allocation, material flow, and multi-step process distributions. The control supports customizable nodes and links, color mapping, tooltip, legend, and interactive hover effects. It helps reveal patterns and proportions in flow-based data for analytical dashboards and reporting applications built on ASP.NET MVC. |
|
|
Syncfusion.AspNetMvc.Sparkline
Syncfusion® ASP.NET MVC Sparkline Charts control renders compact, lightweight inline charts designed to be embedded within table cells, dashboards, and text content for showing trends without taking up much space. It supports Line, Area, Column, WinLoss, and Pie sparkline types with features like markers, tooltips, data labels, range bands, and special point highlighting (high, low, first, last, negative). Ideal for KPI grids, financial reports, and data tables in ASP.NET MVC applications. |
|
|
Syncfusion.AspNetMvc.RangeNavigator
Syncfusion® ASP.NET MVC Range Navigator is a data visualization control used to select a sub-range of data for display in a companion chart or report. It renders a miniature chart (line or area) within a scrollable range selector, allowing users to zoom in on specific time periods or data ranges interactively. It supports DateTime, numeric, and logarithmic axis types, tooltips, labels, and synchronization with other chart controls, making it ideal for financial, stock, and time-series dashboards in ASP.NET MVC applications. |
|
|
Syncfusion.AspNetMvc.Chart3D
Syncfusion® ASP.NET MVC 3D Chart control enables developers to create stunning three-dimensional chart visualizations for data-driven ASP.NET MVC web applications. It supports 3D versions of popular chart types including Column, Bar, Stacked Column, Stacked Bar, and 100percentage Stacked charts. The control provides features like 3D rotation, tilt, depth configuration, legends, data labels, tooltips, and multiple axis support, making it ideal for analytics dashboards and business intelligence applications. |
|
|
Syncfusion.AspNetMvc.BulletChart
Syncfusion® ASP.NET MVC Bullet Chart is a variation of a bar chart that is used to compare a primary measure against one or more other measures within a defined context, such as a target value or qualitative performance range. It supports horizontal and vertical orientations, multiple data ranges (poor, satisfactory, good), comparative measures, and feature measures. Ideal for KPI dashboards, performance tracking, and business intelligence reporting applications built with ASP.NET MVC. |
GitHub repositories
This package is not used by any popular GitHub repositories.
| Version | Downloads | Last Updated |
|---|---|---|
| 34.1.29 | 39 | 7/6/2026 |